6. A transformative experience: attitudinal changes following the intervention
Gabriel-Mugurel Dragomir
Information and awareness campaigns were conducted to promote responsible and sustainable energy consumption regarding electricity consumption, water consumption, thermal energy (heating) consumption and selective waste collection. At the end of the project, the project team registered detectable changes in the sense intended by the campaigns in only three directions. We present further only the data for these significant changes, in a comparative way, before the start of the project (initial phase) and after the completion of the project (final phase), expressed in average numbers for the evaluated sample of students.
ELECTRICITY CONSUMPTION
The project team asked the respondents to select for each of the statements below, an answer variant that describes best their behavior regarding electricity consumption.
Table 1. Results of mean values for usual behaviors related to electricity consumption, before and after information and awareness campaigns
|
Habitual behaviors related to electricity consumption |
Initial (mean) |
Final (mean) |
|
1. I turn off the light when I leave the room |
4.55 |
4.61 |
|
2.I turn off the light when I watch TV |
4.12 |
4.16 |
|
3. I replace classic bulbs with ones that have low energy consumption |
3.95 |
3.73 |
|
4. I air dry clothes, not using the automatic dryer |
4.21 |
4.11 |
|
5. I unplug electrical and electronic appliances that I do not use them (they consume energy even if they are off) |
3.27 |
3.48 |
|
6. I leave the TV on even if I’m not watching it |
2.83 |
2.85 |
|
7. I open the blinds and let as much natural light into the house as possible |
4.43 |
4.46 |
|
8. I set the air conditioner to a temperature no more than 10 degrees lower than the temperature outside during summer season |
2.66 |
3.28 |
|
9. I set the temperature to 20–22° C in the cold season, and if it seems cold, I put on an article of clothing with long sleeves |
3.54 |
3.68 |
|
10.In winter, if it is too hot in the room, I adjust the temperature using the radiator tap |
3.19 |
3.44 |
|
11. I check the number of lifetime hours on the light bulb boxes before buying them |
2.38 |
2.55 |
|
12. I choose to buy household appliances that have low energy consumption |
3.35 |
3.35 |
|
13. I put my mobile phone on power saving mode, so it doesn’t need often charging |
3.08 |
3.28 |
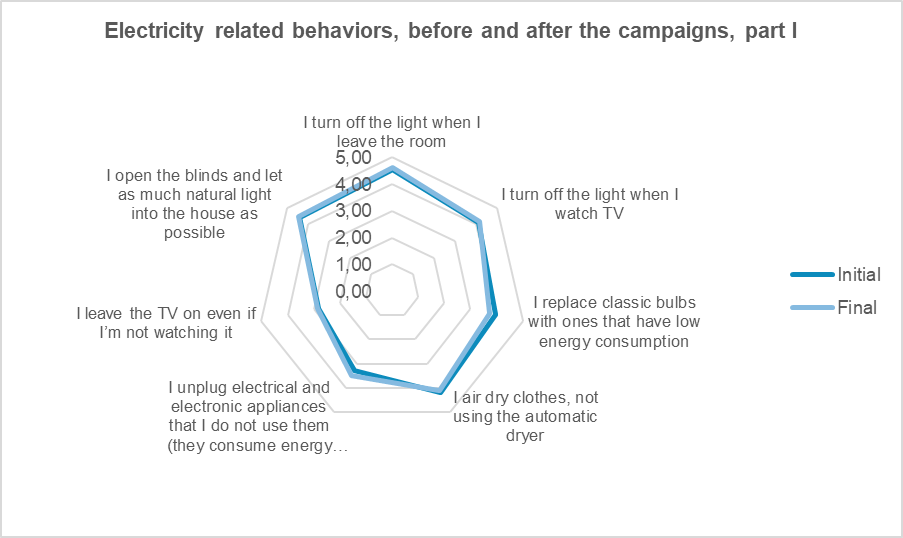
Figure 1. Common behaviors related to electricity consumption, Part I
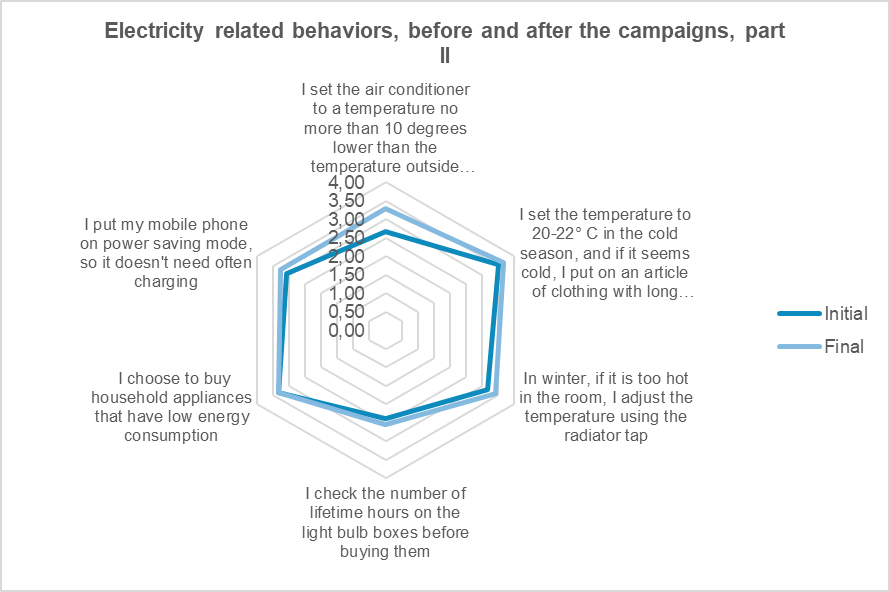
Figure 2. Common behaviors related to electricity consumption, Part II
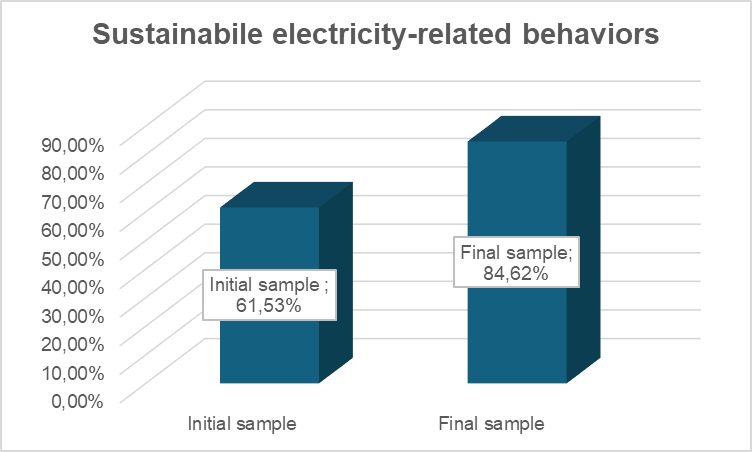
Figure 3 Comparison between samples in electricity consumption
The analysis of different behaviors regarding sustainable electricity consumption revealed significant differences between the beginning of the campaigns and the end of the campaigns conducted throughout the project. The recorded difference was 23.08% in the direction of increasing the occurrence of sustainable behaviors related to electricity consumption.
Significantly changed behaviors in a sustainable sense
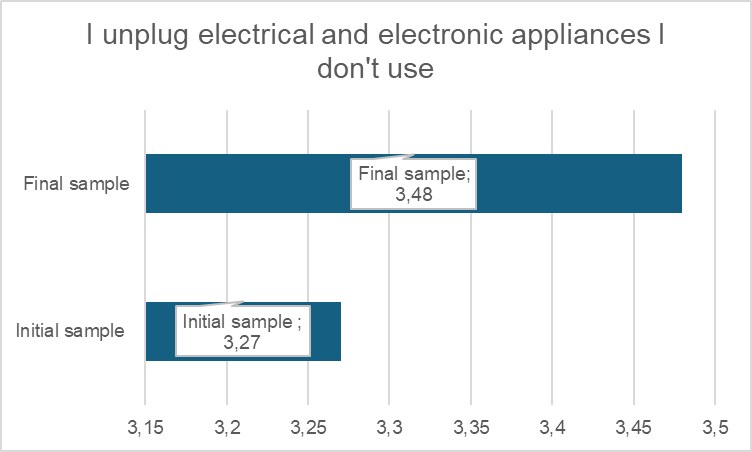
Figure 4. Sustainable behavior leading to unplugging electrical appliances and electronics they do not use.
The analysis of different behaviors in terms of sustainable electricity consumption revealed significant differences between the beginning of the campaigns and the end of the campaigns conducted through the project (Initial mean = 3.27, Final mean = 3.48), in terms of unplugging electrical and electronic appliances (t = -3.31, p = 0.01).
Unmodified behaviors
The behavior of checking the number of hours of lighting on bulb boxes before buying them has not changed much (despite information and awareness campaigns) (Initial mean = 2.38, Final mean = 2.55).
WATER CONSUMPTION
Respondents were asked to select for each of the statements below, an answer variant that best describes their water-related behavior.
Table 2. Results of mean values for habitual behaviors related to water consumption, before and after information and awareness campaigns
|
Habitual behaviors related to water consumption |
Initial (mean) |
Final (mean) |
|
1.I turn the water on to the maximum when washing dishes or food. |
2.32 |
2.29 |
|
2.I let the water run while I brush my teeth. |
2.74 |
2.85 |
|
3. I fix the sink faucet if it drips |
4.15 |
4.03 |
|
4. I watch the time I spend in the shower every day so that I fit in 5, maximum 10 minutes |
2.43 |
3.35 |
|
5. I use washing machine programs at low temperatures (maximum 40 degrees Celsius) |
3.65 |
3.86 |
|
6. I don’t start the washing machine or dishes for a few items/clothes, I wait until it can be fully loaded |
3.99 |
4.15 |
|
7. I let the shower run while I apply soap on myself |
2.84 |
2.88 |
|
8. I turn on the faucets a few minutes before showering |
2.42 |
2.44 |
|
9. I report if I notice any plumbing/water leaks |
4.35 |
4.49 |
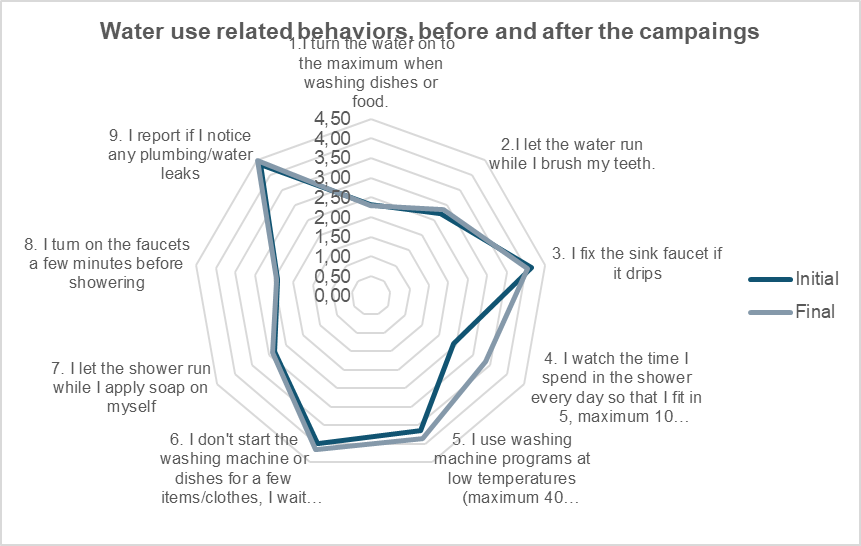
Figure 5. Common water-related behaviors
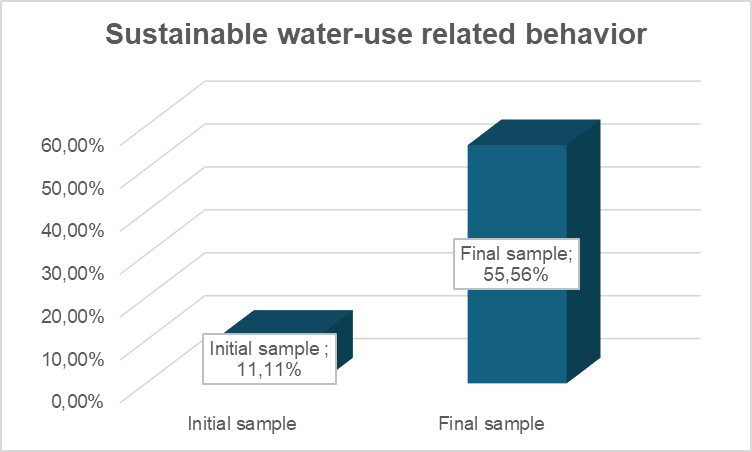
Figure 6. Comparison of student samples related to water consumption.
The difference is 44.44% in terms of increasing the sustainable behaviors, leading to a sustainable water consumption.
The analysis of different behaviors in terms of sustainable water consumption revealed significant differences between the beginning of the campaigns and the end of the campaigns carried out through the project at the following parameters:
• Minding the time spent daily in the shower so that it falls between 5 and 10 minutes (Initial mean = 2.43, Final mean = 3.435; t = -13.371, p = 0.001).
• Use of washing programs at a low temperature (maximum 40 degrees Celsius) (Initial mean = 3.65, Final mean = 3.86; t = -3.6, p = 0.001).
• Waiting for the washing machine or dishwasher to be fully loaded and then used (Initial mean = 3.99, Final mean = 4.15; t = -3.6, p = 0.001).
• Notify administrators if they notice plumbing failures/water leaks (Initial mean = 4.35, Final mean = 4.49; t = 4.35, p = 0.001).
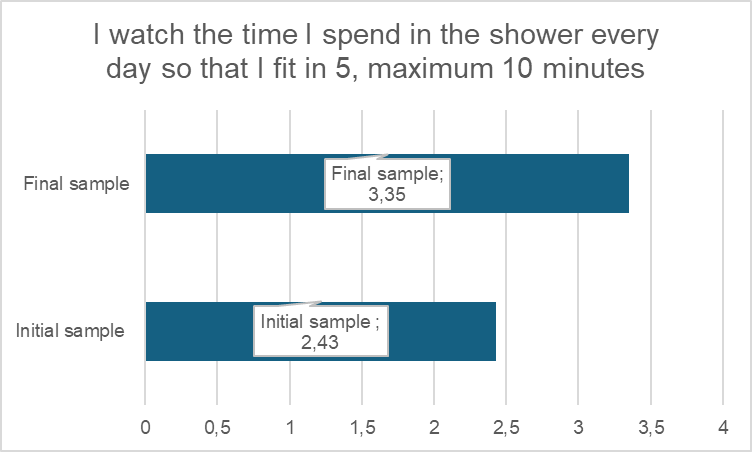
Figure 7. Sustainable behavior of counting time spent daily in the shower.
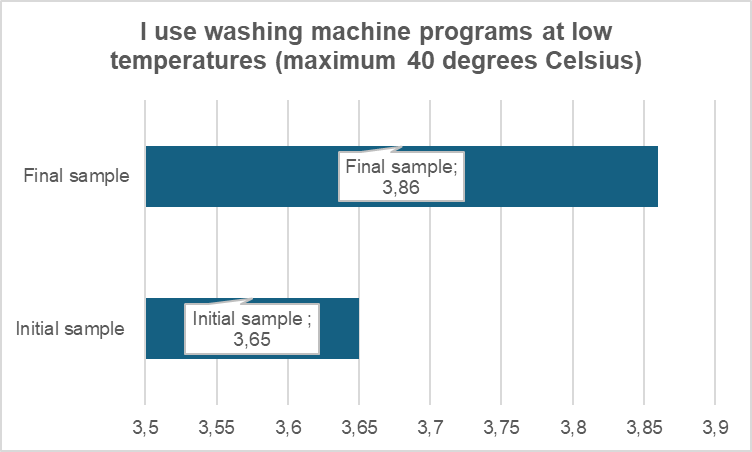
Figure 8. Sustainable behavior of using washing programs at a low temperature (maximum 40 degrees)
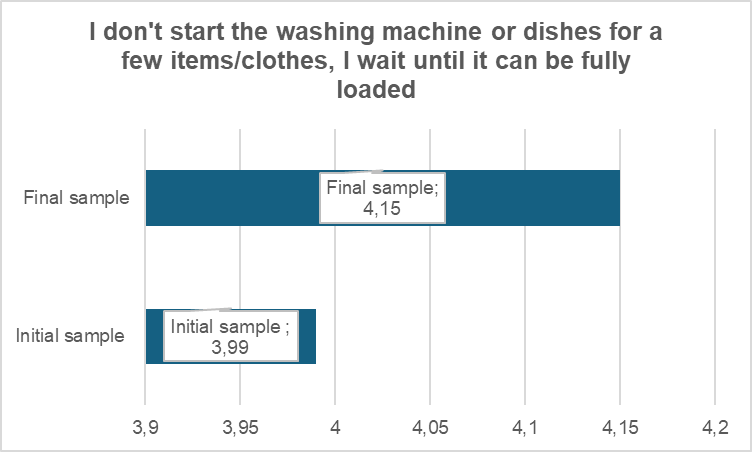
Figure 9. Sustainable behavior resulting in waiting for the washing machine or dishwasher to be fully loaded and then used.
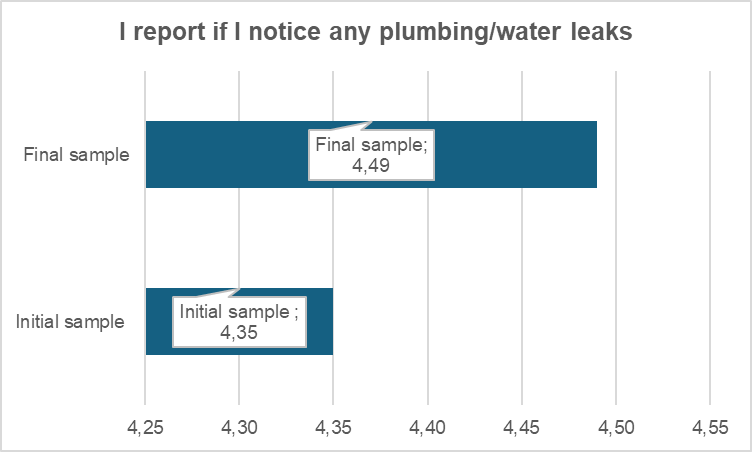
Figure 10. Sustainable behavior by showing interest in the proper functioning of plumbing.
Unmodified behaviors
When it comes to water consumption, we also observed some behaviors that have not changed in a sustainable sense but have remained approximately unchanged.
• Use of taps in the maximum flow position when washing dishes or food (Initial mean = 2.38, Final mean = 2.55).
• Opening the taps a few minutes before taking the shower (Initial mean = 2.42; Final mean = 2.44).
RECYCLING BEHAVIOUR
The project team asked the respondents to select, for each of the statements below, an answer variant that best describes their behavior towards recycling.
|
Recycling-related behaviors |
Initial (mean) |
Final (mean) |
|
1.I recycle glass |
3.91 |
3.91 |
|
2.I recycle plastic containers |
4.01 |
4.09 |
|
3. I recycle batteries |
3.45 |
3.31 |
|
4. I recycle lightbulbs |
3.19 |
3.07 |
|
5. I recycle aluminum (beverage cans, cans, etc) |
3.49 |
3.56 |
|
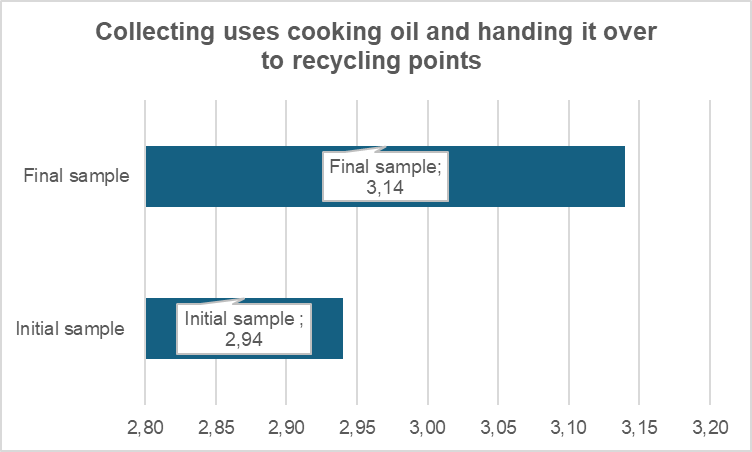
6. I collect used cooking oil and hand it over to recycling points |
2.94 |
3.14 |
|
7. I recycle electronics and household appliances (handing them in collection centers, etc.) |
3.28 |
3.27 |
|
8. I recycle printer toner |
2.71 |
2.67 |
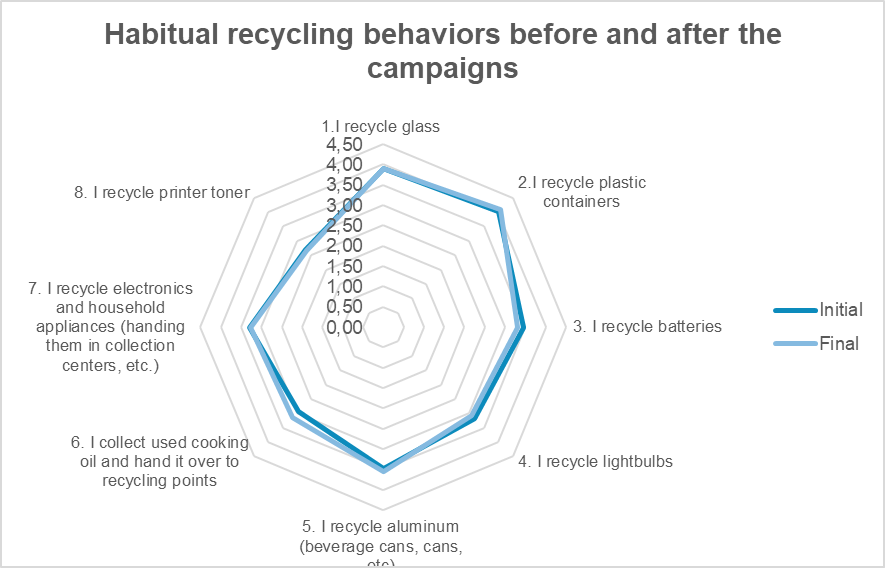
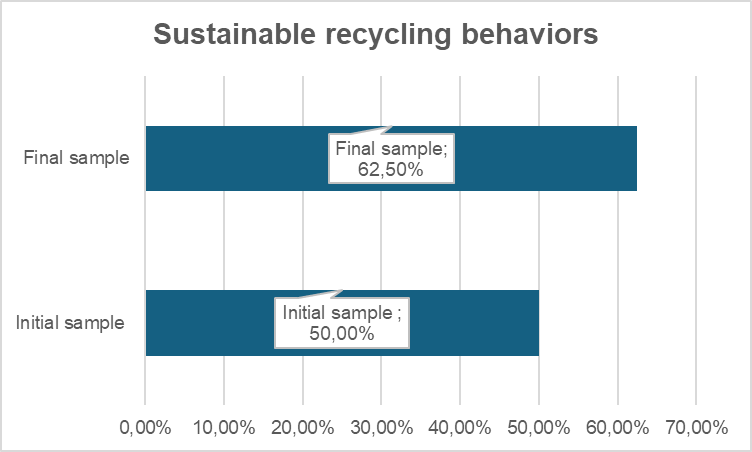
The difference between the beginning and the end of the project is 12.5%, in the sense of increasing sustainable recycling behavior due to the project.
Statistically significant change of behaviors in recycling, leading to sustainability
The analysis of different behaviors in terms of sustainable recycling behavior revealed significant differences between the phases before and after the campaigns conducted through the project in the following parameter:
• Collection of used food oil and its delivery to recycling points (Initial mean = 2.94, Final mean = 3.14; t = -2.638, p = 0.08).
To sum up, the comparative analysis of the self-assessed student behaviors before the start of the project and at the final stage, after the implemented campaigns, indicate that change occurred, but unevenly. The main habitual actions (as measurable signs of the shift towards sustainability) are the following:
• Unplugging electrical and electronic appliances.
• Counting the time spent daily in the shower so that it falls between 5 and 10 minutes.
• Use of washing programs at a low temperature (maximum 40 degrees).
• Waiting for the washing machine or dishwasher to be fully loaded and then used.
• Informing administrators about plumbing failures / water leaks.
• Collection of used food oil and its delivery to recycling points.
The information and awareness-raising campaign conducted over three months proved to be successful, in terms of expected (and obtained) effects. This encourages both the project team and the university management to conduct such campaigns in the future, in accordance with environmental policies at national level, but also with the strategic directives of the Politehnica University Timisoara.